It is the largest city in the sunshine state, and Los Angeles therefore draws a lot of dreamers. Many people move there, or make it their aim, in a bid to capture the buzz and excitement of the sprawling Souther Californian city.
Whether you are looking to relocate, or even visit, today’s round-up is targeting you. It’s easy to get lost in the datasheets when you try and assess what LA has to offer – so today’s post is all about combining some of the best infographics we have seen that showcase what this city is all about.
A breakdown by numbers
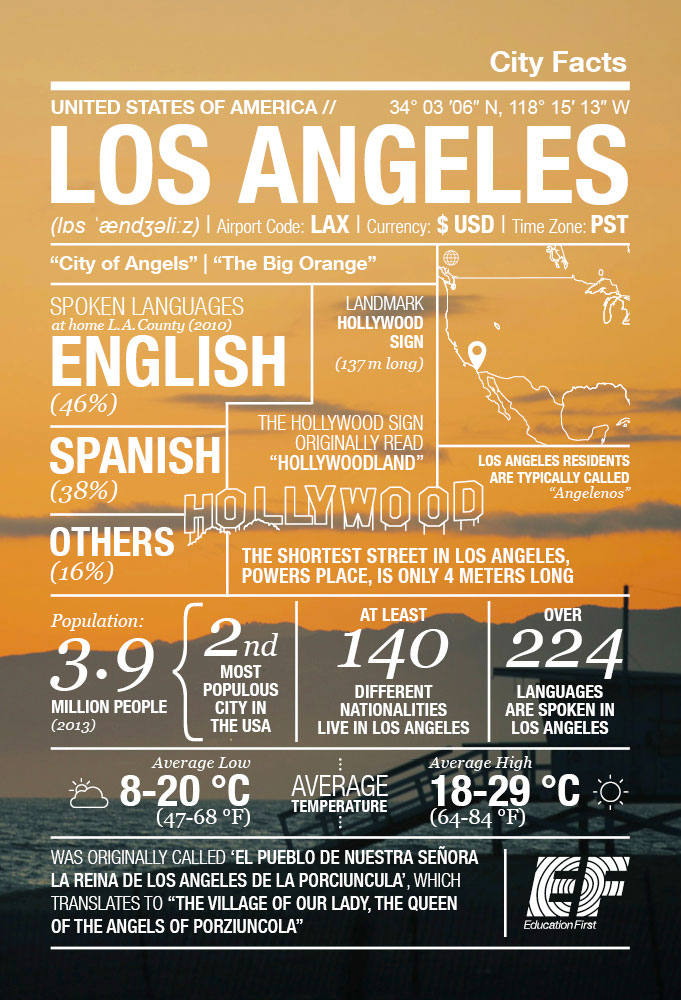
First and foremost, let’s dive into the basics of LA life. This infographic from EF Tours showcases what to expect when you arrive there.
While some of the data might be as expected, others are interesting. For example, less than half of people who live there speak English, with over 224 different languages spoken in total.
The commuting behavior of LA
As we all know, big cities get something of a bad rep for their traffic problems. LA is not an exception.
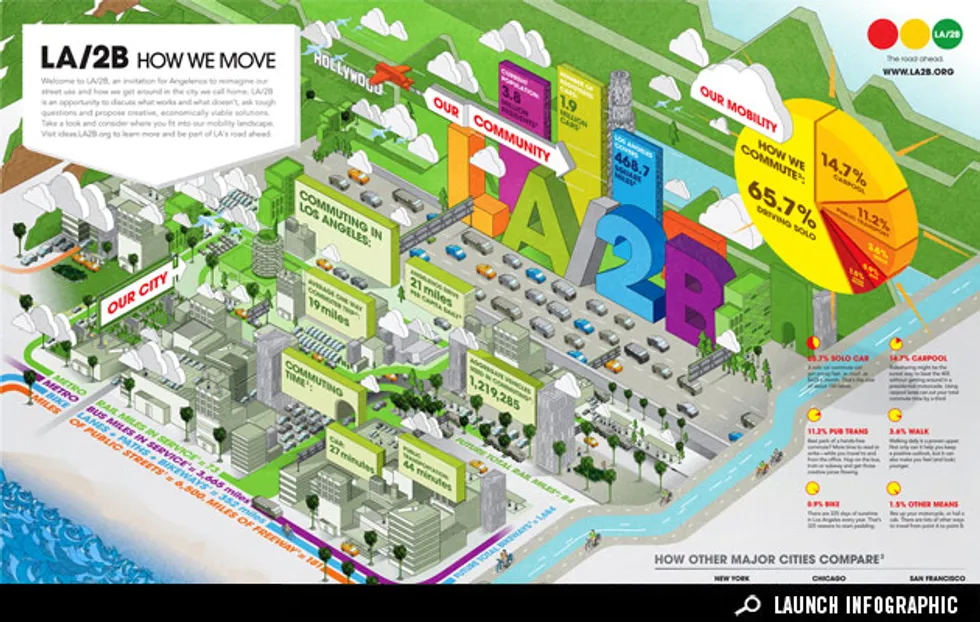
This infographic breaks down how people get around the city (most people drive alone), while it also delves into the typical commuting times. Suffice to say, they are by no means short.
Natural disasters: LA is something of a hotspot
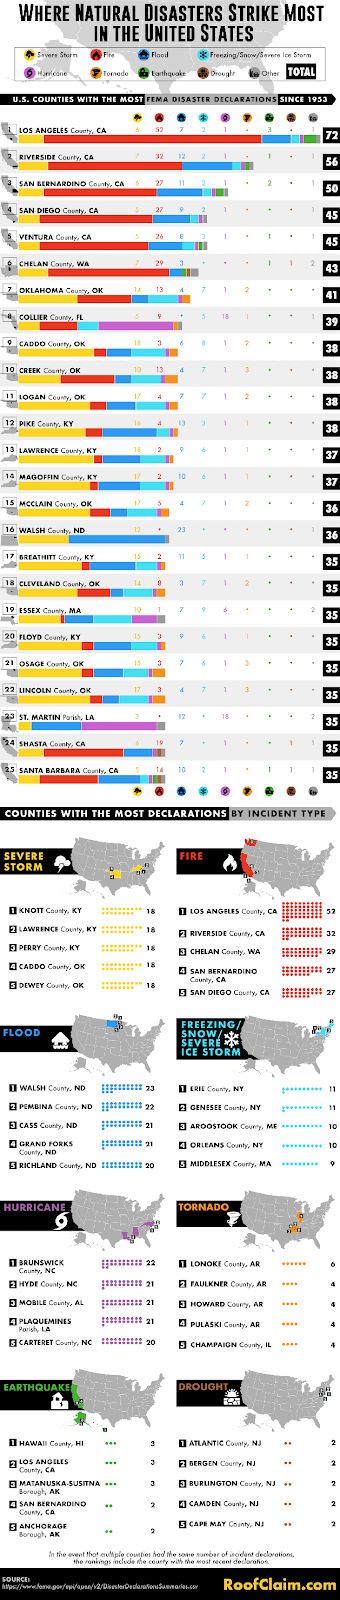
This next graphic isn’t based entirely on LA, but it features prominently. Roof Claim have put together a visual outlook on natural disasters and how they affect different regions around the world. Perhaps unsurprisingly, for those who read the news, LA fares quite badly.
Generally, it is wildfires that pose the biggest risk, although floods and tornados are also up there. Granted, this data spans all the way back to the 1950s and there have been a lot of advancements in housing structure (such as windows and other disaster-related barriers), but it still makes for very interesting viewing.
A demographic overview of LA
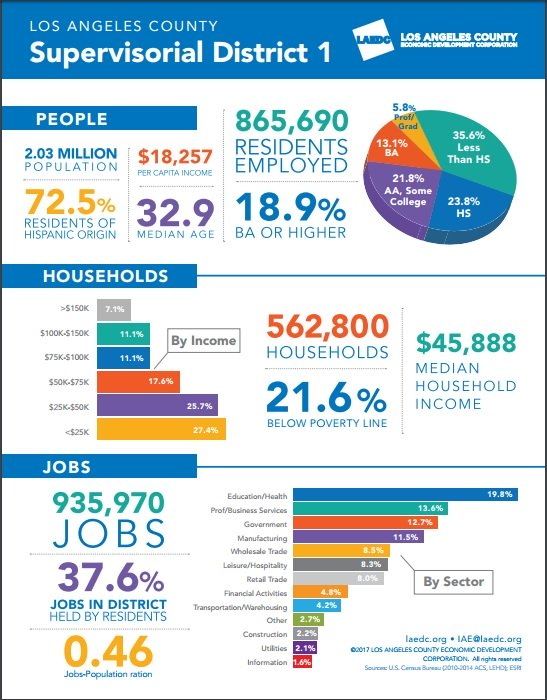
For those of you who are perhaps considering setting up a new life in LA and following a dream, this next infographic might be of interest. It showcases some intriguing data based on the economics of the Los Angeles County. For example, out of a population of 2.03 million people, 865,690 residents are employed there.
From then on you can see that the median household income stands at $45,888, while it also delves into the industries which attract the most jobs, as well as the number of people below the poverty line.
It’s a barrage of data – but in an easily digestible format.
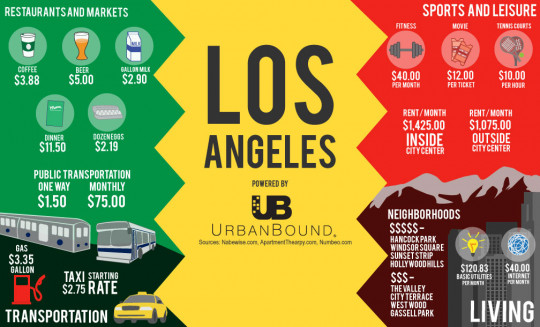
How about the cost of living?
Armed with the above infographic, which talks about typical salaries and the like, the next one should be even more interesting.
It looks at the standard cost of living in LA, allowing you to compare to your current city of choice. It shows how the typical beer will cost $5, while a cup of coffee isn’t significantly cheaper at $3.88.
It also has a section showing the expensive, and less expensive, neighborhoods that you might reside in.
So, what is there to do in LA?
A lot of today’s round-up has focused on the facts and figures of LA – many of which could paint it in a somewhat negative light.
Let’s finish proceedings with the reasons why so many people take the plunge to move there. Graphs.net have shown the top 50 things to do in Los Angeles and in truth, the list could have been much longer.
In short, you’re never going to be bored on a weekend.